ASEAN Economic Comparison
See the scale.
Understand the pace.
One dataset. Eleven economies.
Put Myanmar in a regional perspective.
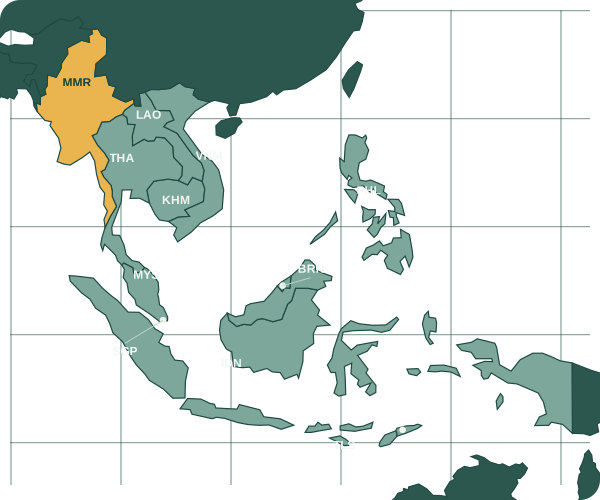
Different measures. Different perspectives.
Explore the region by population, economic size, growth and other key measures.[1]
Reporting-period note Myanmar’s 2026 column, except population, represents FY2025/26 rather than calendar 2026. Details ↓
Nominal GDP
2026 column · estimates / projections / US$ billion
Sorted by value. Bars start at zero. Units vary by indicator.
All eleven, side by side.
The year selector above updates this table too. Scroll horizontally on smaller screens.
| Country | Populationmillion | Nominal GDPUS$ billion | GDP per capitaUS$ | Real GDP growth% | Consumer price inflation% · annual average | Current account balance% of GDP |
|---|---|---|---|---|---|---|
| IndonesiaIDN | 287.20 | 1,480.0 | 5,153 | 5.1 | 3.3 | -1.6 |
| SingaporeSGP | 6.12 | 667.9 | 109,117 | 5.0 | 2.3 | 16.7 |
| ThailandTHA | 71.56 | 599.1 | 8,372 | 2.1 | 2.1 | -1.2 |
| MalaysiaMYS | 34.23 | 547.1 | 15,981 | 5.2 | 2.2 | 2.1 |
| VietnamVNM | 103.08 | 542.1 | 5,259 | 8.4 | 4.7 | 0.3 |
| PhilippinesPHL | 115.07 | 501.7 | 4,360 | 3.4 | 5.6 | -4.8 |
| MyanmarMMR | 55.19 | 83.2 | 1,507 | 2.0 | 20.0 | -0.8 |
| CambodiaKHM | 18.05 | 54.2 | 3,001 | 3.0 | 5.6 | -8.7 |
| BruneiBRN | 0.47 | 18.9 | 40,613 | 1.9 | 0.8 | 23.7 |
| Lao PDRLAO | 7.89 | 18.4 | 2,331 | 4.5 | 9.2 | 5.1 |
| Timor-LesteTLS | 1.43 | 2.2 | 1,520 | 4.0 | 2.1 | -38.5 |
Myanmar uses fiscal years. Timor-Leste’s real growth is for the non-oil economy. Some 2025 observations are estimates, depending on the country and indicator.[1][2]
From numbers to informed decisions.
Separate the period from the publication date
The 2026 column contains IMF estimates and projections; 2025 includes actuals and estimates. All figures use the same October 2026 WEO vintage.
Myanmar uses fiscal-year data
For GDP, growth, inflation and the current account, Myanmar’s “2026” corresponds to April 2025–March 2026 (FY2025/26). This differs from other countries’ calendar years. Population is a separate estimation series.
Dollar values are nominal
Nominal GDP and GDP per capita depend on exchange rates and are not PPP measures. GDP per capita is not a measure of average salary or household income.
Keep the definitions in view
Inflation is the annual-average percentage change; the current account is a share of GDP. Timor-Leste’s real growth refers to the non-oil economy, while nominal GDP covers the total economy. Displayed values are rounded.
Definitions and reporting periods: IMF WEO, its appendix and country metadata.[1][2]
SOURCES & DATESSources and reporting periods.
Sources and reporting periods.
Based on the October 2026 IMF workbook downloaded on 13 October 2026. Its publication timestamp is 02:00 UTC on that date. This page does not update automatically.
- [1]IMF / 13 OCT 2026
World Economic Outlook · October 2026 ↗
Population, nominal GDP, GDP per capita, real GDP growth, annual-average CPI inflation and current account balance. The 2025 and 2026 columns are used.
- [2]IMF / METHODOLOGY
WEO Database Appendix & country metadata ↗
Reporting periods, latest actual observations and estimation conventions. Country-specific notes are also recorded in the Excel metadata.
- [3]ASEAN / 26 OCT 2025
Timor-Leste’s admission to ASEAN ↗
Timor-Leste became the eleventh member on 26 October 2025. This comparison includes all eleven members.
- [4]NATURAL EARTH / PUBLIC DOMAIN
Map data: Natural Earth ↗
A schematic location map. Small countries are also indicated by dots.